[Author Prev][Author Next][Thread Prev][Thread Next][Author Index][Thread Index]
Re: [tor-dev] Two new Onionoo versions 2.4 and 2.5 add new "effective_family" and "measured" fields
On Wed, Aug 19, 2015 at 02:27:10PM +0200, Karsten Loesing wrote:
> The new version 2.5 that I deployed this week adds the optional
> "measured" field to details documents. The main idea behind this new
> field is that relay operators and Tor network debuggers can now figure
> out easily whether a relay is affected by not being measured by a
> sufficient number of bandwidth authorities and as a result has lower
> usage than it could handle. This field is not yet displayed by the
> Onionoo clients Atlas or Globe, but it's accessible via Onionoo's API
> [2]. More details are on ticket #16020 [3].
>
> [2] https://onionoo.torproject.org/protocol.html#details
>
> [3] https://trac.torproject.org/projects/tor/ticket/16020
Onionoo is great. Here are a couple of graphs that have to do with the
"Measured" flag.
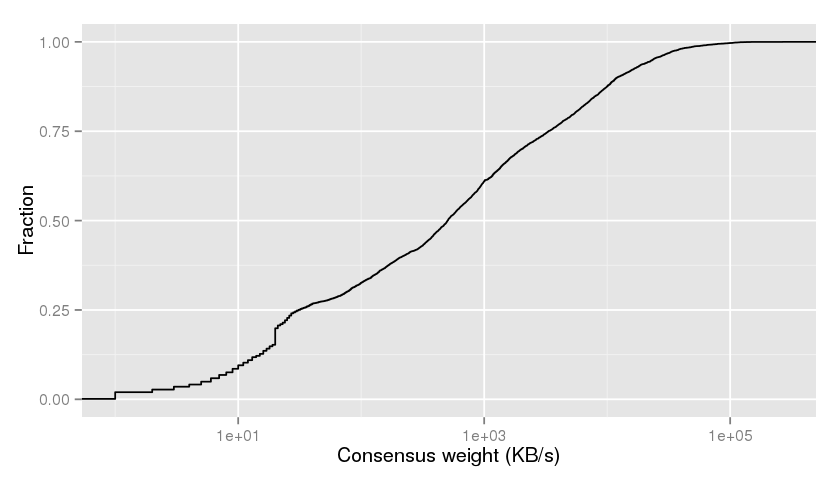
The first one is a CDF of consensus weight (which maps to e.g. the
probability of using a relay in a circuit). Check out the big rise at a
consensus weight of 20. That's caused by the default bandwidth setting
of 20 KB/s when a relay is unmeasured:
https://gitweb.torproject.org/tor.git/tree/src/or/dirvote.h?id=tor-0.2.6.10#n89
/** Default bandwidth to clip unmeasured bandwidths to using method >=
* MIN_METHOD_TO_CLIP_UNMEASURED_BW. (This is not a consensus method; do not
* get confused with the above macros.) */
#define DEFAULT_MAX_UNMEASURED_BW_KB 20
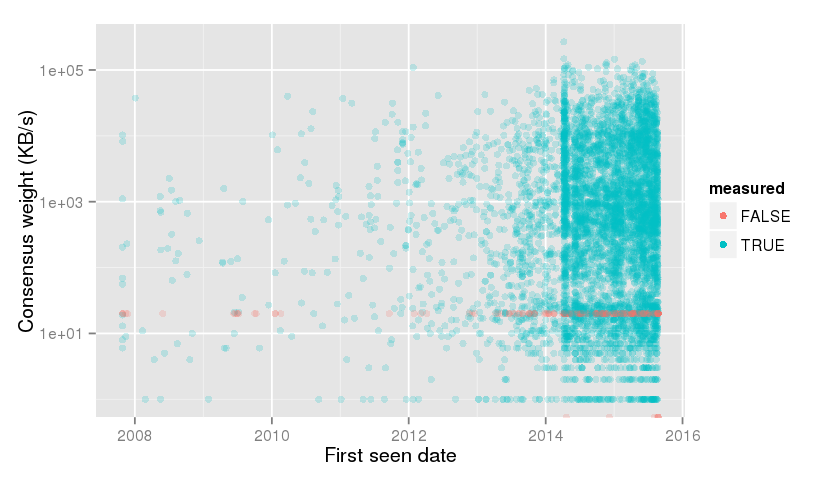
The second graph shows the age of all currently running relays (first
seen date) with the consensus weight. The unmeasured relays are colored
differently. See how they all fall on the 20 KB/s line.
library(ggplot2)
library(rjson)

details <- fromJSON(file="https://onionoo.torproject.org/details?type=relay";)
# Convert JSON into a data.frame.
relays <- Filter(function(x) { x[["running"]] }, details[["relays"]])
relays <- do.call(rbind, lapply(relays, function(x) {
	as.data.frame(c(
		x[c("nickname", "measured", "consensus_weight", "first_seen")],
		exit=(("Exit" %in% unlist(x["flags"])) & !("BadExit" %in% x["flags"]))
	))
}))
relays$first_seen <- as.POSIXct(relays$first_seen, tz="GMT")

p <- ggplot(relays, aes(consensus_weight))
p <- p + stat_ecdf()
p <- p + scale_x_log10()
p <- p + labs(title=NULL, x="Consensus weight (KB/s)", y="Fraction")
ggsave("consensus_weight.png", p, width=7, height=4, dpi=120)

p <- ggplot(relays, aes(first_seen, consensus_weight, color=measured))
p <- p + geom_point(alpha=0.2)
p <- p + scale_y_log10()
p <- p + labs(title=NULL, x="First seen date", y="Consensus weight (KB/s)")
p <- p + guides(color=guide_legend(override.aes=c(alpha=1)))
ggsave("first_seen.png", p, width=7, height=4, dpi=120)
_______________________________________________
tor-dev mailing list
tor-dev@xxxxxxxxxxxxxxxxxxxx
https://lists.torproject.org/cgi-bin/mailman/listinfo/tor-dev