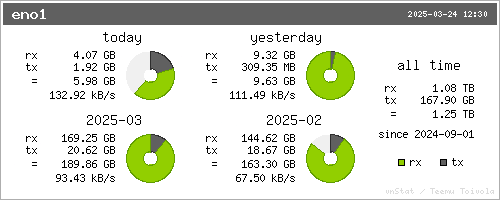
Here is how that would look (inline images might not work in mailing list, check summary.png if you can not see an image here):
-GH
On Friday, March 21st, 2025 at 1:24 PM, Tor at 1AEO via tor-relays tor-relays@xxxxxxxxxxxxxxxxxxxx wrote:
Unfortunate there isn't a website that graphs / charts the aggregate changes by IP address range over time, not just individual relay changes over time and aggregate at a point in time
On Monday, March 10th, 2025 at 10:32 AM, boldsuck via tor-relays tor-relays@xxxxxxxxxxxxxxxxxxxx wrote:
On Monday, 10 March 2025 15:34 boldsuck via tor-relays wrote:
The Tor network is a dynamic massive network and bandwidth contributions and
overall consensus weight are constantly changing. When a larger operator
(like NTH or RWTH Aachen) goes up or down everything changes.
In addition, the Tor network team and DirAuth's may change consensus rules
at any time.2 servers, all relays same config & uptime, but still have different advertised
bandwidth ;-)https://metrics.torproject.org/rs.html#search/2a0b:f4c2:2:1::
https://metrics.torproject.org/rs.html#search/2a0b:f4c2:2::--
╰_╯ Ciao Marco!Debian GNU/Linux
It's free software and it gives you freedom!_______________________________________________
tor-relays mailing list -- tor-relays@xxxxxxxxxxxxxxxxxxxx
To unsubscribe send an email to tor-relays-leave@xxxxxxxxxxxxxxxxxxxx_______________________________________________
tor-relays mailing list -- tor-relays@xxxxxxxxxxxxxxxxxxxx
To unsubscribe send an email to tor-relays-leave@xxxxxxxxxxxxxxxxxxxx