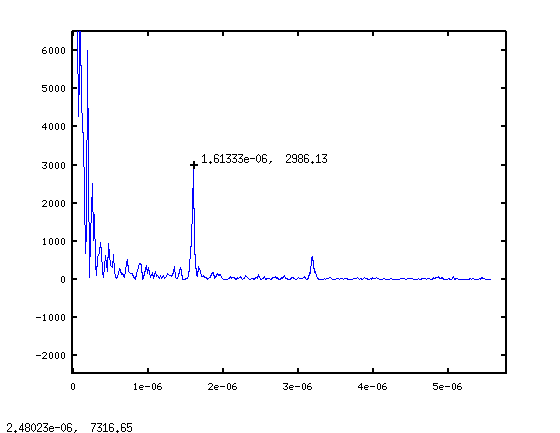
On Mon, Sep 12, 2011 at 7:20 AM, Curious Kid
<letsshareinformation@xxxxxxxxx> wrote:
> http://metrics.torproject.org/users.html?graph=bridge-users&start=2011-06-14&end=2011-09-12&country=all&dpi=72#bridge-users
>
> The spike this September dwarfs the early August spike at over 1 million bridge users. Maybe that means college is in session, but I've got a bad feeling it's something else. Maybe it's the natural escalation of the cat and mouse game by someone that really hates the idea of bridge nodes.

Does anyone know if this is caused by any one country or group of
countries in particular? (Perhaps corresponding to the Dutch theorem
of a previous thread?)

Is this is an automated phenomenon or a human one?

Human traffic has a distinct signature: usage peaks on weekends. You
can see it clearly in the graphs. Quantified with a power spectrum:
see 1.png attached. Notice the big peak at a frequency of about 1.6e-6
Hz, which corresponds to a periodicity of one week.

That's data for usage from Iran from the beginning of this year until
last week. The same is true for other countries, but one cannot do
this analysis on the global aggregate data because it loses a lot of
signal to noise due to time zone differences, unfortunately. Although,
there are (tedious) ways to fix that...

So, in a few weeks there will be data to test this hypothesis...

I would love to also see data from that "get bridges via email" system
(# of requests per day, by country), if it's not already available. If
privacy is an issue, adding in Gaussian noise shouldn't harm this kind
of analysis.

--
Mansour
Attachment:
1.png
Description: PNG image
_______________________________________________
tor-talk mailing list
tor-talk@xxxxxxxxxxxxxxxxxxxx
https://lists.torproject.org/cgi-bin/mailman/listinfo/tor-talk