Does anyone know why there are very large values appearing in the state file ?
With kind regards,
Cav Edwards
Karsten Loesing wrote:
Hi everyone,

I'm planning to add new passive performance metrics to Tor so that we
can better understand why it's slow and how we can improve it. Here is a
list of performance metrics we already have and a few ideas for new
metrics. If anyone has an idea what other metrics might be missing or
how we can improve the existing/planned metrics, please let us know!


Performance metrics we already have:

- write-history and read-history: Total written and read bytes

- dirreq-v[23]-{direct,tunneled}-dl: Network status download times

- cell-processed-cells: Number of processed cells per circuit

- cell-queued-cells: Mean number of cells contained in circuit queues

- cell-time-in-queue: Mean time cells spend in circuit queues

- cell-circuits-per-decile: Number of active circuits per day

- exit-kibibytes-{written,read} and exit-streams-opened: Written and
read bytes and opened streams exiting the Tor network

Just in case you just learned that we have these kinds of data and want
to look at them more closely, you'll find the daily updated July 2010
extra-info descriptors containing these metrics here:

  http://metrics.torproject.org/data/extra-infos-2010-07.tar.bz2

If you happen to find out something useful, please let us know, too! :)


New performance metrics:

1. Written and read bytes spent on answering directory requests

Mike wants to know for his bandwidth weights how many bytes we're
writing and reading for directory requests as compared to all bytes. We
could add two new lines in the style of write-history and read-history
that declare how many bytes were spent on directory requests, including
both direct connections to the Dir port and tunneled requests via
BEGIN_DIR cells:

    "dirreq-read-history" YYYY-MM-DD HH:MM:SS (NSEC s) NUM,NUM... NL
        [At most once]
    "dirreq-write-history" YYYY-MM-DD HH:MM:SS (NSEC s) NUM,NUM... NL
        [At most once]

        Declare how much bandwidth the OR has spent on answering
        directory requests.  Usage is divided into intervals of NSEC
        seconds.  The YYYY-MM-DD HH:MM:SS field defines the end of the
        most recent interval.  The numbers are the number of bytes used
        in the most recent intervals, ordered from oldest to newest.

Here are some example numbers from my test relay, together with the
write-history and read-history lines for comparison:

write-history 2010-07-10 19:53:30 (900 s) 126585824,118608860,
160984887,215227933,279503671,292334518,247741024,219398726,402868466,
171578104,134845462,103864240,339932861,197773378,313857195,172963329,
155526629,252937014,244187702,197075966,152386190,175927358,163121741,
178683670,257434914,113004935,113712270,105843282,163919436,209717008,
145912027,185671909,214901809,120711828,177862476,215853506,151845080,
246348316,249139845,159824705,189301611,149167678,174661744,148893984,
166705025,96488337,113451396,125986495,83252142,111691155,89342727,
181081343,247091129,222168462,127634564,151465333,284533765,235486901,
288744935,243722540,187109053,140379274,107682143,155506145,215314138,
165721878,172790983,194321640,263295290,196657740,206465896,181921549,
157166653,216171620,273935225,341610717,254576134,287283026,345218991,
218867344,221304725,159918366,219410175,317998413,267456903,370347960,
360990463,227152997,210737304,328228011,284975201,195563699,169440384,
225952664,167331447,206871134
read-history 2010-07-10 19:53:30 (900 s) 111893867,101529861,143895849,
194786027,259952571,273497972,232257574,199549600,385105937,153788132,
117426290,84115625,322626270,179367559,293464555,155173008,140076076,
237776118,225444069,180710872,138166684,160516398,148001360,161921342,
243594475,100661995,102812182,90311549,151614536,197647669,135284514,
170708653,202502593,108863871,165358926,203496697,142017462,230877056,
235022066,146810734,176047157,135151618,161136000,134416764,154471070,
84377707,100789666,112208099,72023045,97726026,75320408,161555620,
229979123,205614801,111857592,133387588,265711511,216666832,270679486,
226124920,171931895,123012431,88188621,135887568,197036553,148318468,
155601095,174911703,241373709,176322860,188172703,161709145,139134142,
196972335,254543821,319215780,235328518,268214943,325796822,197507205,
201169007,143374694,201244669,296243416,246725945,353965769,337025998,
200899391,189473401,309588351,266155617,173460369,152280169,206597244,
147200841,184052057
dirreq-write-history 2010-07-10 19:53:30 (900 s) 646347,560172,696779,
830638,619676,602628,361450,740160,524300,568569,731671,854635,605561,
564858,678157,532414,719312,494666,1301201,944818,527056,202686,1013200,
553622,402782,416251,531494,366742,429971,664552,321484,617111,291196,
397877,657988,323410,261872,698337,656536,958921,315250,222864,296399,
657562,291304,532770,325678,409172,606387,573317,753559,764482,400565,
464494,567049,451342,127342,492985,315013,887299,688030,589603,389064,
223902,329524,807354,1215069,423756,697600,907185,723453,689116,538715,
511851,558052,620773,354970,586254,421827,822856,786349,609691,638619,
651930,653235,393705,627669,635353,554215,234620,725708,575857,538672,
335683,846807,454024
dirreq-read-history 2010-07-10 19:53:30 (900 s) 492788,18459,30148,
37121,533625,23774,163742,33518,553467,165008,31612,40248,530115,158371,
27364,35238,539279,23376,166453,14047,525003,13245,163134,29956,615381,
19639,11663,23016,600257,27761,14674,17969,495159,144806,13802,22840,
490508,149164,19911,31915,597266,12861,20509,17639,493599,139914,14597,
20603,494243,158505,34142,41609,508383,32690,160229,33347,508837,16767,
151166,34133,556447,164360,27186,16380,13605,694385,39106,30262,41665,
675799,32311,14205,28536,670198,37591,32236,23552,644491,29737,39118,
21215,670186,17262,27210,34859,654266,25168,34874,29585,648736,13492,
30356,19431,518298,173052,32005

I'm wondering if we're really spending these few bytes on answering
directory requests. But even if these numbers are wrong, one gets the
idea what this metric is about.


2. Bidirectional use of connections

BjÃrn Scheuermann and Florian Tschorsch of Uni DÃsseldorf want to know
what fraction of connections are used bidirectionally. They suggested to
count read and written bytes per connection in 10-second intervals and
classify connections as "below threshold", "mostly reading", "mostly
writing", and "both reading and writing":

    "conn-stats-end" YYYY-MM-DD HH:MM:SS (NSEC s) NL
        [At most once]

        YYYY-MM-DD HH:MM:SS defines the end of the included connection
        statistics measurement interval of length NSEC seconds (86400
        seconds by default).

        A "conn-stats-end" line, as well as any other "conn-*" line,
        is first added after the relay has been running for at least 24
        hours.

    "conn-bidirectional" BELOW,READ,WRITE,BOTH NL
        [At most once]

        Number of connections, split into 10-second intervals, that are
        used uni-directionally or bi-directionally.  Every 10 seconds,
        we determine for every connection whether we read and wrote less
        than a threshold of 20 KiB (BELOW), read 10 times more than we
        wrote (READ), wrote 10 times more than we read (WRITE), or read
        and wrote more than the threshold, but not 10 times more in
        either direction (BOTH).  After classifying a connection, read
        and write counters are reset for the next 10-second interval.

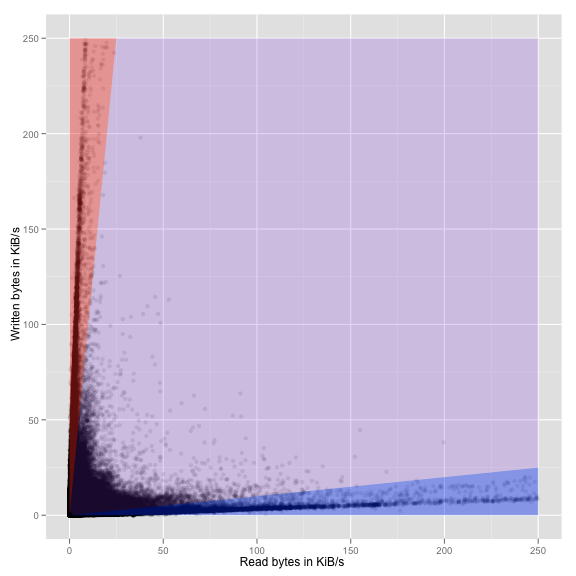
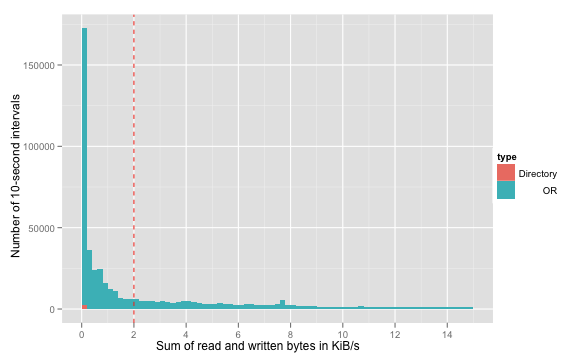
I performed an early analysis based on the findings on my test relay.
Attached to this mail you'll find a histogram and a scatterplot that we
used to determine the threshold of 20 KiB (or 2 KiB/s) and the factor 10
as parameters.

Here are the results of my test relay:

conn-stats-end 2010-07-10 19:53:38 (84600 s)
conn-bidirectional 315227,55437,66653,97878

These numbers imply that 97878 of 55437+66653+97878, or 44.5% of all
connections are used bidirectionally.

An open question is whether we should distinguish between connections to
other relays and to clients. I wonder if there's an easy way to tell the
two connection types apart.


Comments? Thoughts?

Thanks,
--Karsten

