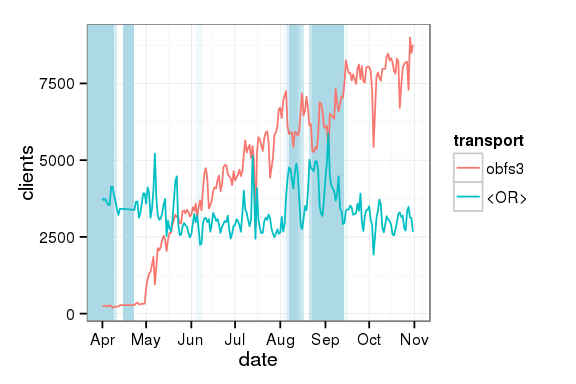
On Wed, Nov 05, 2014 at 12:17:50PM +0100, Karsten Loesing wrote:
> On 01/11/14 01:44, David Fifield wrote:
> > This might be the key to the mystery. It must be that PacificSunset,
> > despite being an obfs3 bridge, doesn't have ExtORPort enabled, so all
> > its obfs3 connections are being counted as <OR> connections.
>
> Hi David,
>
> sorry for not replying earlier and for not replying in more detail.
>
> I just wanted to say that your analysis looks plausible to me.  Fixing
> PacificSunset's ExtORPort might indeed fix the metrics graphs.

Here's one more graph on the subject. The shading in the background
indicates when PacificSunset was running (blue) and not running (white).
It looks like the periods of highest correlation come while it is
running.

I got the uptime information from
https://onionoo.torproject.org/uptime?search=pacificsunset.

David Fifield
Attachment:
obfs3-or-pacificsunset.png
Description: PNG image
library(ggplot2)

uptime = data.frame(
	date=seq(from=as.Date("2013-11-04"), to=as.Date("2014-11-05"), by="2 days"),
	frac=c(999,957,0,20,999,999,999,999,999,999,999,999,999,999,999,999,999,999,999,999,999,999,520,0,228,874,353,999,999,999,457,0,0,0,0,0,853,999,999,999,749,749,0,457,999,999,999,999,999,999,999,NA,999,999,999,478,0,0,0,185,999,999,999,999,999,999,999,999,999,999,999,999,999,999,999,999,999,999,478,0,0,NA,NA,NA,NA,0,0,0,0,0,0,0,0,0,0,0,0,0,0,0,0,0,0,0,0,0,166,208,0,0,0,0,0,0,0,0,0,0,0,0,0,0,0,0,0,0,0,0,0,0,0,0,0,0,0,0,104,395,999,999,999,790,541,0,0,686,999,999,999,999,999,999,999,999,999,999,999,166,0,0,0,0,0,0,0,0,0,0,0,0,0,0,0,0,0,0,0,0,20,0,0,0,0,66)/999
)

c <- read.csv("clients.csv", colClasses=c(date="Date"))

p <- ggplot(c[c$date >= as.Date("2014-04-01") & c$date < as.Date("2014-11-01") & c$node=="bridge" & (c$transport=="obfs3" | c$transport=="<OR>"), ])
p <- p + geom_rect(data=uptime, aes(xmin=uptime$date, xmax=uptime$date+2, ymin=-Inf, ymax=Inf), fill="lightblue", alpha=uptime$frac)
p <- p + geom_line(aes(date, clients, color=transport))
p <- p + xlim(c(as.Date("2014-04-01"), as.Date("2014-11-01")))
p <- p + theme_bw()
ggsave("obfs3-or-pacificsunset.png", p, width=4.8, height=3.2, dpi=120)
_______________________________________________
tor-dev mailing list
tor-dev@xxxxxxxxxxxxxxxxxxxx
https://lists.torproject.org/cgi-bin/mailman/listinfo/tor-dev