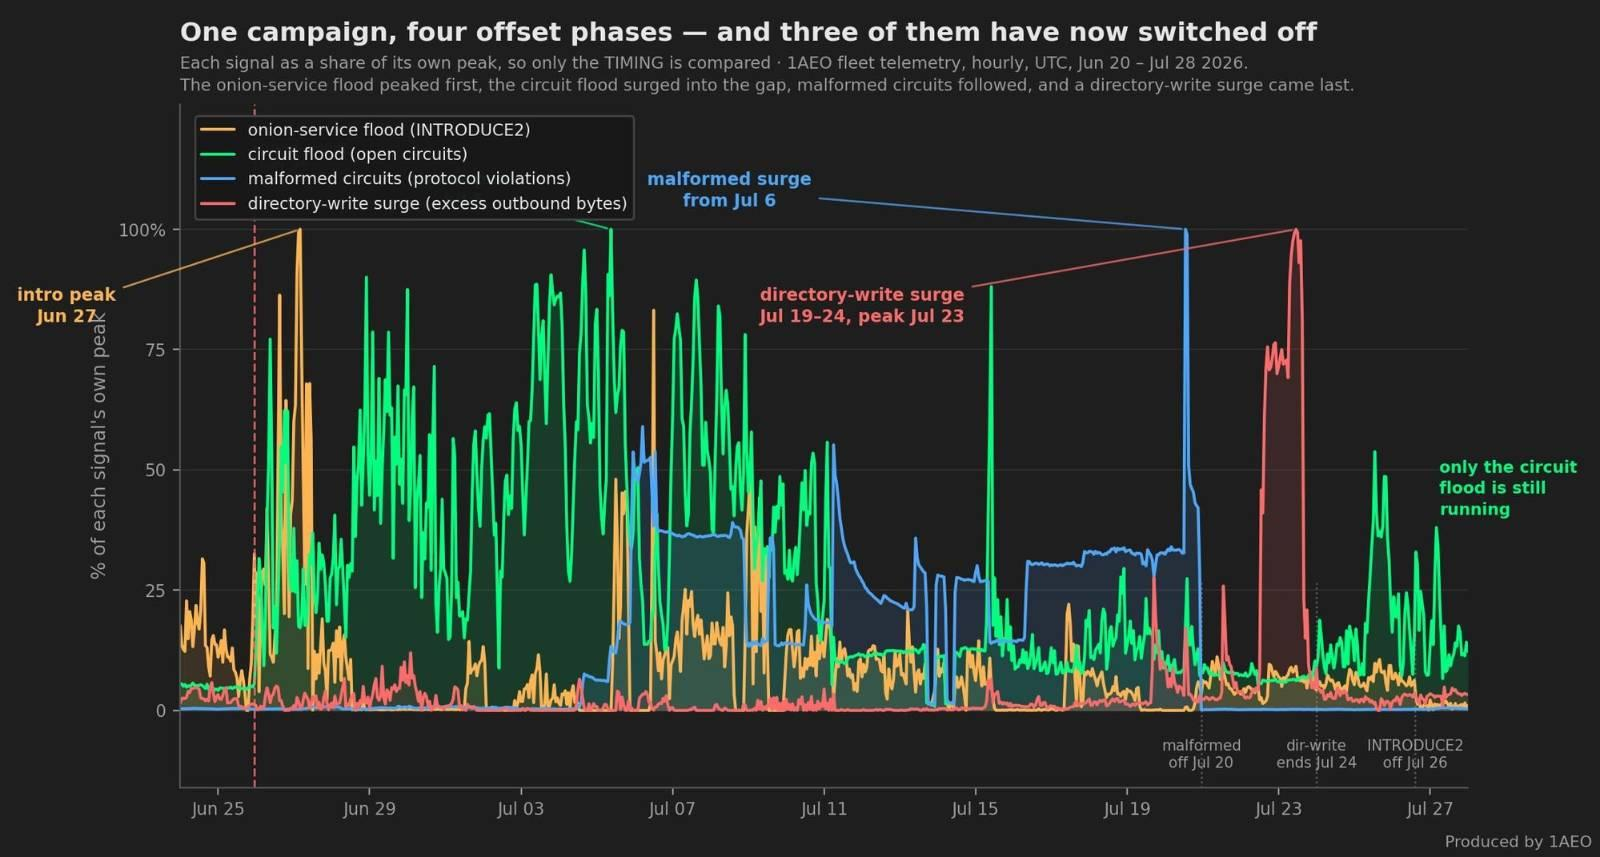
We can confirm the divergence fleet-wide, date it, and explain it: a directory-serving write surge, 07-19 → 07-24, now over.

Shape: fleet written/read held 0.99–1.07 through every wave since June. First tick 07-19 ~18:00 UTC; hard episode 07-22 ~18:00 → 07-23 ~18:00, peaking 2.15× — written ~2.5× to ~9.2 GB/s, read flat. Normal since 07-24.

It's directory serving: at peak, our DirCache 0 relays (no V2Dir) sat at 1.01; our dir-cache guards ran up to 2.4–2.7×. Your example relay is a Guard+HSDir+V2Dir cache. Small requests in, multi-cell responses out.

Public data, network-wide (CollecTor extra-infos dirreq-write-history): ~150–205 TB/day baseline → 400–450 (07-19→21) → ~810/~730 TB on 07-22/23 (~4×) → ~200 on 07-24. Same window as our fleet.

First time in a year of this flood our overload count moved (steady 2–4 relays through everything): one event 07-23 19:00–22:00 UTC → peak 94 relays in overload-general (07-26), decaying since. Trigger: tor's MaxMemInQueues OOM handler — ~246 GB freed in 18 h, ~2k max-cell kills; zero onionskin drops, no CPU saturation, no kernel OOM. Outbound queues ballooning on large directory responses (slow-read), not compute. Operators in your ML thread seeing out≫in: check for [warn] We're low on memory, not CPU — raise MaxMemInQueues to its default (unset ⇒ auto: 40% of RAM, capped at 8 GB) and keep swap generous.

Context: the malformed vector shut off 07-20 ~21:45 UTC (~7,200/s → ~25/s), this surge ran 07-19→24, and INTRODUCE2 collapsed ~73M → ~5M/day over 07-26→28 — the rotation continues. And the surge preceded HSDir's 07-22 year-low (945): at least partly a descriptor-fetch flood, not just demand concentrating on the surviving caches.


Cross posting from gitlab tracking issue: https://gitlab.torproject.org/tpo/network-health/analysis/-/work_items/113#note_3437003


On Monday, July 20th, 2026 at 2:52 AM, chappie7--- via tor-relays <tor-relays@xxxxxxxxxxxxxxxxxxxx> wrote:

> The same thing happened to me. After the traffic spike lasted for several hours, my relay even lost its HSDir flag. I’ve seen this happen several times in the past as well, and I think we need to find out what is causing it.
> - - -
>

>

> Heartbeat: Tor's uptime is 4 days 8:30 hours, with 14984 circuits open. I've sent 1197.09 GB and received 704.58 GB.
> - - -
> 2026-07-19
>          00:00      21.03 GB |    22.06 GB |    43.08 GB |     12.26 MB/s
>          01:00      16.81 GB |    17.90 GB |    34.71 GB |      9.87 MB/s
>          02:00      17.99 GB |    18.98 GB |    36.97 GB |     10.52 MB/s
>          03:00      46.48 GB |   195.40 GB |   241.88 GB |     68.80 MB/s
>          04:00      46.37 GB |   234.14 GB |   280.51 GB |     79.79 MB/s
>          05:00      44.80 GB |   226.16 GB |   270.95 GB |     77.07 MB/s
>          06:00      12.46 GB |    12.44 GB |    24.90 GB |      7.08 MB/s
>          07:00      13.35 GB |    13.48 GB |    26.83 GB |      7.63 MB/s
>          08:00      19.01 GB |    19.87 GB |    38.89 GB |     11.06 MB/s
>          09:00      23.32 GB |    24.26 GB |    47.58 GB |     13.53 MB/s
>          10:00      21.33 GB |    22.21 GB |    43.53 GB |     12.38 MB/s
>          11:00      11.70 GB |    12.16 GB |    23.86 GB |     14.04 MB/s
>

> - - -
> Please pay attention to the output between 3:00 and 5:00.
> _______________________________________________
> tor-relays mailing list -- tor-relays@xxxxxxxxxxxxxxxxxxxx
> To unsubscribe send an email to tor-relays-leave@xxxxxxxxxxxxxxxxxxxx
>
Attachment:
image.png
Description: PNG image
Attachment:
publickey - tor@1aeo.com - 0x9288289B.asc
Description: application/pgp-keys
Attachment:
signature.asc
Description: OpenPGP digital signature
_______________________________________________
tor-relays mailing list -- tor-relays@xxxxxxxxxxxxxxxxxxxx
To unsubscribe send an email to tor-relays-leave@xxxxxxxxxxxxxxxxxxxx