[Author Prev][Author Next][Thread Prev][Thread Next][Author Index][Thread Index]
[tor-dev] What's the explanation for weekly cycles in user graphs?
When you look at the user graphs, many of them show a weekly cycle.
What's our explanation for why this occurs?
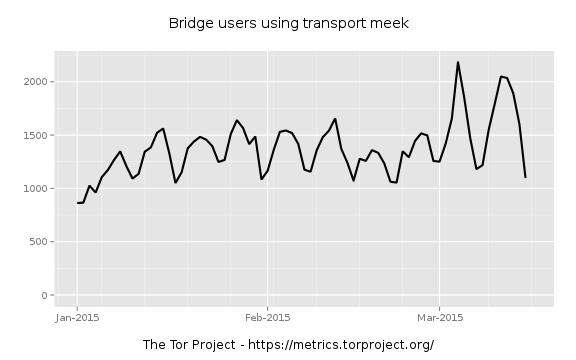
I notice it strongly when I look at the graphs for the meek pluggable
transport, where usage is high on weekdays and lower on weekends. The
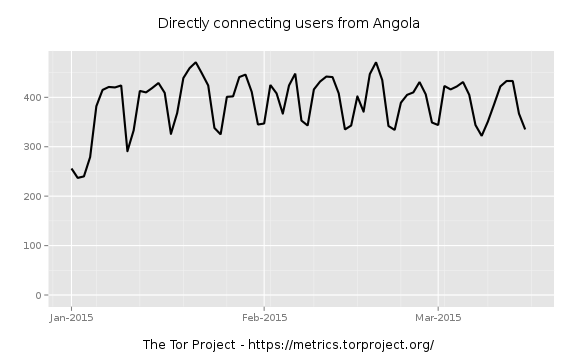
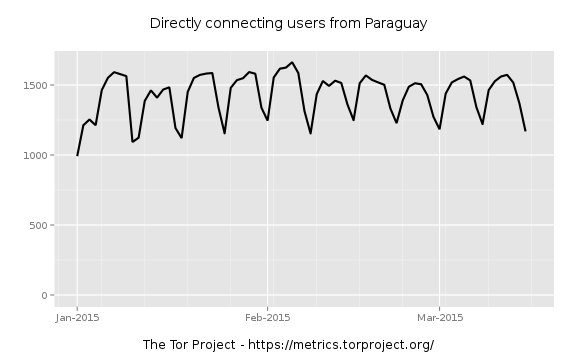
same thing happens in some per-country graphs. (In all these graphs, the
light white vertical lines are Mondays.)
https://metrics.torproject.org/userstats-bridge-transport.html?graph=userstats-bridge-transport&start=2015-01-01&end=2015-03-18&transport=meek
https://metrics.torproject.org/userstats-relay-country.html?graph=userstats-relay-country&start=2015-01-01&end=2015-03-18&country=ao&events=off
https://metrics.torproject.org/userstats-relay-country.html?graph=userstats-relay-country&start=2015-01-01&end=2015-03-18&country=py&events=off
You can eyeball more examples in the omni-graph:
https://people.torproject.org/~dcf/graphs/relays-all.pdf
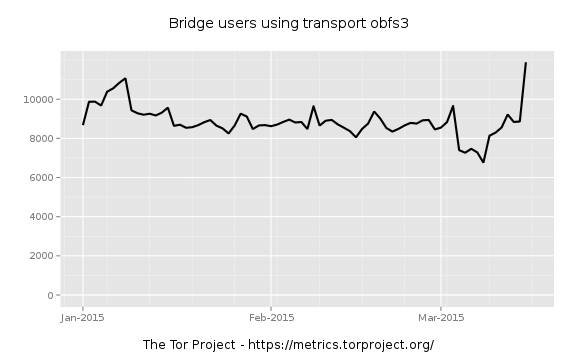
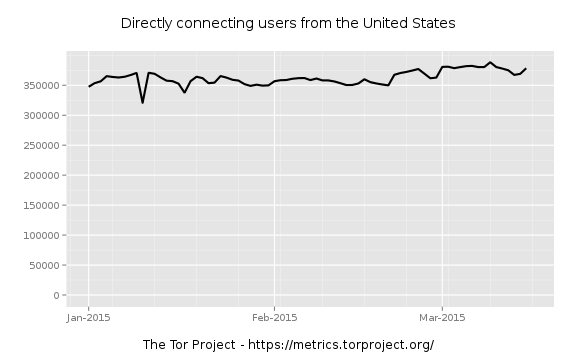
But it doesn't look like that everywhere. Here are graphs for obfs3 and
the United States:
https://metrics.torproject.org/userstats-bridge-transport.html?graph=userstats-bridge-transport&start=2015-01-01&end=2015-03-18&transport=obfs3
https://metrics.torproject.org/userstats-relay-country.html?graph=userstats-relay-country&start=2015-01-01&end=2015-03-18&country=us&events=off
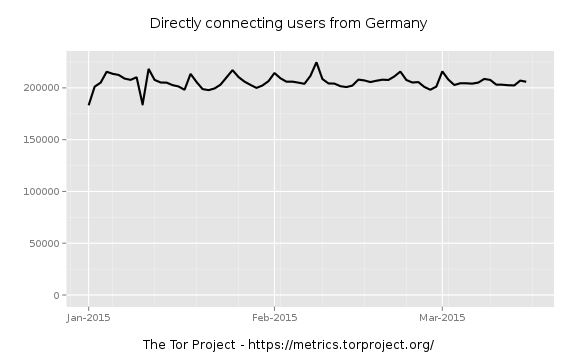
And there is perhaps even the opposite pattern, where there are small
peaks on the weekends, like in Germany:
https://metrics.torproject.org/userstats-relay-country.html?graph=userstats-relay-country&start=2015-01-01&end=2015-03-18&country=de&events=off
Is there a usual story we tell to explain what's happening? A few
hypotheses:
* People use Tor at work to get their job done (work firewall blocks
sites they need).
* People use Tor at work to goof off.
* People are relaxing and partying on the weekends, not sitting in
front of a computer.
* People don't have good Internet at home, so they use it more at work
(and Tor use just correlates with Internet use).
George Danezis's tech report on discovering censorship events describes
the weekly patterns but doesn't offer a cause.
https://research.torproject.org/techreports/detector-2011-09-09.pdf
"The deployed model considers a time interval of seven (7) days to model
connection rates... The key reason for a weekly model is our observation
that some jurisdictions exhibit weekly patterns. A 'previous day' model
would then raise alarms every time weekly patterns emerge"
David Fifield
_______________________________________________
tor-dev mailing list
tor-dev@xxxxxxxxxxxxxxxxxxxx
https://lists.torproject.org/cgi-bin/mailman/listinfo/tor-dev